Every investor eventually asks themselves the same question:
Why settle for 3% when I could get 7%, 9%, even 12%?
On the surface, the math seems obvious: a $500,000 portfolio yielding 3% generates $15,000 per year. At 9%, that jumps to $45,000. Same capital, triple the income. It feels like discovering a hidden door in the market—one that others have somehow overlooked.
But markets don’t hand out free lunches. When yields climb, something else is changing—often quietly, and often in ways that don’t show up in a brokerage account’s “income” column.
The truth is simple but frequently misunderstood:
Income ETFs differ in yield, but also by where that yield comes from.
Once you understand that, the entire landscape of income investing becomes clearer—and a lot less deceptive.
Three Sources of Yield
Most income-focused ETFs fall into one of three categories. They may look similar on a screener, but they behave very differently over time.
1. “Good Yield”: Income from Businesses
This is the traditional model. Companies generate profits, share a portion via dividends, and—if well managed—grow those payments over time.
Stocks like MO and funds like VYM, SCHD, and SDY live here.
This also includes UTG and UTF, with profit from utilities and infrastructure, more stable NAV than most high-yield funds and inflation-linked.
Although a Closed End Fund, ADX has no leverage and long-term NAV growth, so best fits in this category.
These ETFs typically yield in the 2%–4% range, sometimes a bit higher depending on market conditions. That may not sound exciting, but there are important characteristics beneath the surface:
Dividends are backed by corporate earnings
Many holdings have decades-long payout histories
Net asset value (NAV) tends to grow over time
Historically, this category has delivered the most reliable combination of income and total return. It’s not flashy, but it works.
The tradeoff is obvious: you don’t get 7% income upfront. You get something slower—but far more durable.
2. “Engineered Yield”: Income from Markets
This is where things start to get interesting—and where many modern income products operate.
Funds like JEPI, JEPQ, SPYI, GPIQ, QQQI, IWMI, IDE and QDVO generate income by combining stocks with options strategies, typically selling call options to collect premiums.
That changes the equation.
Instead of relying solely on dividends, these funds generate cash flow from the market itself. The result is yields often in the 7%–10% range, with relatively smooth monthly distributions.
This category has several appealing features:
Higher income without extreme leverage
Less reliance on corporate dividend policies
Potential for tax efficiency (depending on structure)
But there is no free lunch here either.
By selling options, these funds limit upside participation. In strong bull markets, they tend to lag. Over long periods, that tradeoff can matter more than investors expect.
Still, for many retirees, this category represents a reasonable middle ground: higher income than traditional dividend funds, without the more severe structural issues of the highest-yield products.
3. “Return-of-Capital Yield”: Income from Yourself
This is the category that causes the most confusion—and, over time, the most disappointment.
Closed end funds like AOD, AGD, TRIN, LGI and funds like QYLD, XYLD, and RYLD often advertise yields in the 9%–12%+ range.
That gets attention, as it should.
But the structure matters. These funds typically sell fully covered calls on nearly 100% of their portfolios, systematically trading away most of their upside in exchange for immediate income.
Over time, two things tend to happen:
Distributions remain high, creating the appearance of strong income
NAV drifts downward, as limited upside fails to offset market declines and payouts. Of the funds mentioned, TRIN and LGI are at the highest risk of NAV erosion.
The result is a subtle but important shift: part of the “income” investors receive is effectively their own capital being returned to them.
This doesn’t mean these funds are inherently “bad.” They can serve a purpose, particularly for investors prioritizing current cash flow over long-term growth.
But they are often misunderstood.
A double-digit yield can feel like success—right up until you zoom out and look at total return.
PDI is an example of “Return-of-Capital Adjacent”, not exactly the same but may behave similarly over time. Yield is real (credit income + leverage), but uses leverage and may distribute more than it earns at times.
Why the 7% Line Is So Hard to Cross
Investors often search for a fund that checks every box:
Yield above 7%
Long history of stable payouts
Minimal or no NAV erosion
In practice, that combination is extremely rare.
The reason is structural.
Equities rarely produce 7%+ sustainable income without sacrificing growth
Options strategies can generate higher income, but cap upside
High payouts often require either leverage, premiums, or returning capital
In other words, once yield moves meaningfully above the natural income produced by businesses, it has to come from somewhere else.
And that “somewhere else” always introduces tradeoffs.
The Behavioral Trap
If the tradeoffs are real, why do so many investors still gravitate toward the highest yields?
Because income is visible—and total return is not.
A monthly deposit hitting your account feels tangible. It reinforces the sense that your portfolio is “working.” Meanwhile, gradual NAV decline is easy to ignore, especially in sideways markets.
This creates a powerful psychological loop:
High income feels like success
Stable distributions reinforce confidence
Long-term erosion remains hidden
Until it isn’t.
A Better Way to Frame Income Investing
Instead of asking, “What yields the most?” a more useful question is:
“What is generating this income—and what am I giving up in return?”
That shift in perspective leads to a more balanced approach:
Use “good yield” funds as a foundation
Layer in “engineered yield” selectively for higher income
Treat “return-of-capital yield” products with caution and clear expectations
There’s nothing wrong with wanting 7% income. But there is something dangerous about assuming all 7% yields are created equal.
AI Portfolio
Chat GPT suggested the following portfolio as an example of responsibly balancing income with NAV stability:
30% UTF - real asset income and NAV anchor
20% UTG - real asset income and NAV anchor
20% QQQI - boost income without full NAV decay
10% GPIQ - boost income without full NAV decay
10% MO - true dividend engine
10% SGOV - damp volatility, reduce drawdown risk
The Bottom Line
The market offers plenty of ways to generate income. But it does not offer a way to generate high income without tradeoffs.
There are many funds with long, consistent dividend histories.
There are many funds yielding more than 7%.
But there are very few that offer both—and that’s not an accident.
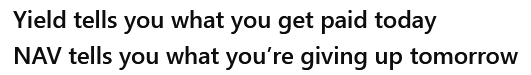
In income investing, yield is just the headline.
The real story is where the yield comes from.
Conclusion
In the search for satisfactory yields, be mindful of capital (NAV) preservation.
Best Wishes,
Patient_Zero
Scripture of the Week
Wisdom makes one wise person more powerful than ten rulers in a city. - Ecclesiastes 7:19